搭建信息系统的前期准备 知识点题库
①开发模式的选择 ②概要设计 ③需求分析 ④详细设计 ⑤可行性分析
在实施时正确的步骤是( )
-
(1) 下列选项可能是他在这一阶段要考虑的内容的是 (多选:填写正确选项前的字母)。A . 预算硬件购买,软件开发所需的费用,为节省资金计划采用家里闲置的计算机充当服务器 B . 编写应用程序代码并调试运行 C . 评估现有开发工具和开发平台是否能够满足功能需求 D . 分析“室内环境实时监测系统”对提高健康生活质量的意义 E . 撰写“室内环境实时监测系统”的使用说明书
-
(2) 该系统搭建完成运行后,可以通过浏览器实时显示温湿度和污染情况变化,体现了该系统的功能。
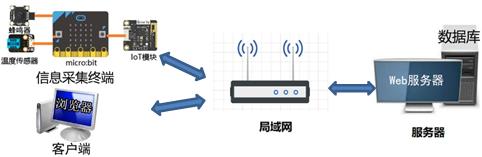
信息采集终端部分代码如下:
IP = "10.89.1.2" ; PORT= "8080" ; SSID = "jxtx" #设置连接参数
PASSWORD = "20220626"
Uart.init(baudrate = 115200,bits=8,parity=None,stop=1,tx=pin2,rx=pin1) while Obloq.connectWifi(SSID, PASSWORD, 10000) ! = True:
display.show(Image.SAD) display.scroll(Obloq. ifconfig( ))
Obloq.httpSet(IP, PORT) #根据ip 和port 建⽴连接
while True:
temp,hum = dht11.read(16) #读取温度、湿度
ermo,resp = Obloq.get("input?x="+str(temp)+ "&y="+str(hum), 10000)
if errno== 200:
display.scroll(resp)
else:
display.scroll(str(errno))
sleep(1000*60) #设置采集间隔时间
WEB 服务器部分代码如下所示:
from flask import Flask
app = Flask( name )
@app.route('/') def index():
#读取终端最近一次的温度和湿度存⼊ temp 和hum,代码略return "当前温度"+str(temp)+ "当前湿度"+str(hum)
@app.route('/input',methods=['POST', 'GET']) def add_data(): #终端上传最新采集的数据
#代码略
if name == ' main ':
app.run(host="10.89.1.2", port=8080)
-
(1) 搭建系统的前期准备⼯作有如下5个主要过程:①开发模式的选择 ②概要设计 ③ 需求分析 ④详细设计 ⑤可⾏性分析,在实施时正确的步骤是( )(选填字⺟)A . ③①④②⑤ B . ③⑤①②④ C . ③⑤①④② D . ⑤③①④②
-
(2) 物联⽹IoT模块连接开发板的引脚是( )(选填字⺟)A . pin0 和pin1 B . pin1 和pin2 C . pin16 D . PORT
-
(3) Web服务器端采⽤(选填:POST 或GET)⽅式接受温度和湿度数据。若某时刻温度数值是28,湿度值53,则传输数据时使⽤的URL 是(选填字⺟)
A. //10.89.1.2:8080/input?temp=28&hum=53
B. //10.89.1.2:8080/input&temp=28?hum=53
C. //10.89.1.2:8080/input?x=28&y=53
D. //10.89.1.2:8080/input &x=28?y=53
-
(4) 当⼤棚温度超过警戒温度28℃时,系统会发出温度报警提醒。⼩明从服务器的SQLite数据库中导出了1~6⽉份的温度数据并整理到Excel⽂件,数据格式如图a所示。利⽤Python编写程序统计每⽉发出报警提醒的次数并按图b所示可视化。

图a

图b
统计及可视化的部分程序如下,请补充完善:
df=pd.read_excel('温度数据.xlsx') df1 =
g1=df1.groupby('⽉份',as_index=False).count( )
plt.bar(g1.⽉份, g1.温度)
plt.title('1-6 ⽉份发出温度报警提醒次数情况')
plt.show( )


