编程处理数据与可视化 知识点题库
⑴确定;⑵建立迭代;⑶对迭代过程进行,这是编写迭代程序必须考虑的问题,不能让迭代过程无休止地重复执行下去。
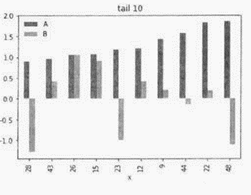
import pandas as pd
import numpy as np
import matplotlib.pyplot as plt
plot_ data = pd. DataFrame(np. random. randn(50, 2), columns -['A', B'])
# np. random. randn(50, 2)产生两列、每列50个随机数
plot_ _data. sort values('A')[- 10:]plot(kind='bar')
plt. title('tail 10')
plt. xlabel('x')
plt. ylabel('y')
plt. show( )
该程序段运行后绘制的图形为( )
 B .
B .  C .
C .  D .
D . 
import matplotlib.pyplot as plt
import numpy as np
# numpy. linspace(start, stop, num=50)
#产生从start到stop的等差数列,num为元素个数,默认50个
x = np.linspace(0, 1, 50)
y1=x**2
y1=**2
y2 = np.sqrt(x)
y3=x**5
plt.figure( )
①
②
③
plt.legend( )
plt.show( )


-
(1) 图所示数据集文件名为,出租车ID、时间、经度、纬度、夹角角度、出租车的瞬时速度和出租车载客状态数据的间隔符为,经度、纬度的数据类型为。
-
(2) 绘制该数据集中出租车行驶轨迹的Python程序如下,请在方框中填写合适的代码,完善程序。
import matplotib. pyplot as plt
def track(file): #绘制GPS坐标轨迹
jd=[ ] #经度
wd=[ ] #纬度
for line in open(file):
#切分行数据生成列表
line_data=line. split(',')
#取轨迹坐标

jd. append(x)
wd. append(y)
plt. plot(jd, wd)
filename='Taxi_ 105. txt'
track(filename)
plt. show( )
-
(3) 运行程序,绘制的图形如图所示。说说你从图中发现了什么。

-
(4) 尝试编写Python程序,从该数据集中挖掘其他你感兴趣的信息。
import numpy as np
import matplotlib.pyplot as plt
plt. figure(figsize=(9,6))
n=5000
x=np. random. randn(1,n) #返回n个随机数,具有标准正态分布
y=np. random. randn(1,n)
t=np. arctan2(x,y) #函数arctan2(x,y)返回给定的坐标值的反正切值
plt. scatter(x,y,c=t,s= 15,alpha=0.5,marker='o')
# s:散点的大小,t:散点的颜色, alpha:是透明程度
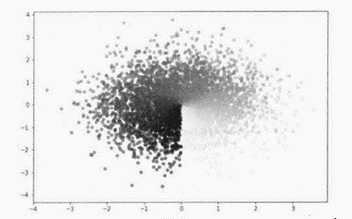
请回答下列问题:
-
(1) 每次运行程序绘制的数据点个数为 。
-
(2) 每次运行程序绘制的散点图 (选填:“相同” 或“不同”)。
-
(3) 本次绘制的散点图中,数据点的分布有什么特征?
请回答下列问题:
-
(1) 文件chj.txt中的数据为(选填:“结构化数据”或“非结构化数据”)。
-
(2) 处理文件chj.txt中的数据生成chjfc.txt文件的过程,一般称为 。
-
(3) 编写如下Python程序,读取chjf.txt文件中的数据,并统计其中各词语(2个及以上文字构成)出现的次数。在划线处填写合适代码,完善程序。
txt = open('chjfc. txt', 'r', encoding='utf-8'). read( )
words-txt. split( )
word_ counts={ }
for word in words:
if len(word)==1:
continue
else:
① #可以为1行或多行代码
#使用word_counts计算词语word在words中出现的次数
word_ list=list(word_counts. items( )) #返回所有键值对信息,生成列表
word_ list. sort(key-lambda x:x[1], reverse=True) #按词语出现次数降序排序
for i in range(20):
word, times= ②
print(word, times)
程序中划线①处应填写的代码是
程序中划线②处应填写的代码是
-
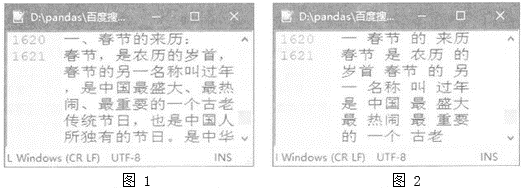
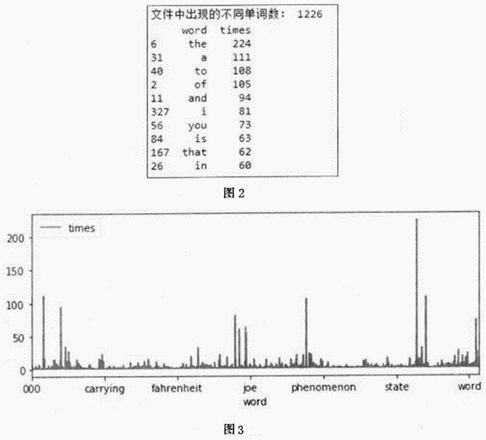
(4) 去除步骤(3)程序的统计结果中的非特征词(如代词介词连词等)后,制作的标签云如图所示,标签云中最能表现文件chj.txt中文本特征的词有(写出3~5个)。

-
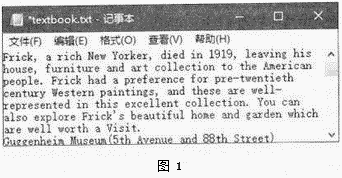
(1) 图1中单词的间隔有 。
-
(2) 自定义函数cleantext( )的功能是。
-
(3) 在划线处填入合适代码,完善程序。
import pandas as pd
def cleantext( ):
txt = open("textbook.txt","r"). read( )
txt= ① #将字符串中所有大写字母转为小写
for ch in '! ( );:''',.? ' :
txt = txt.replace(ch,"") #用空格替代ch的值
return txt
booktxt = cleantext( )
words = booktxt. split( )
#以空格为分隔符分割文本并生成列表
counts= { }
for word in words:
counts[word]=counts. get( word,0)+1
items= -list(counts. items( )) #返回所有键值对信息,生成列表
df= pd.DataFrame(items,columns=['word','times'])
df1= df.sort _values('word')
df1.plot( x='word', y='times', kind='line', igsize=(8,3))
df2= ②
print('文件中出现的不同单词数:', ③ )
print(df2[:10])
① ② ③
-
(4) 运行程序,输出结果如图2所示,绘制的图形如图3所示。结合两图分析,该教材中出现次数超过50次的单词有哪些?这些单词有什么特征?
-
(5) 若将该教材中单词的掌握程度分为“非常熟练”“熟练”“一般”三类输 出,请完善下表。
掌握程度
程序末尾须添加的输出语句
非常熟练(出现10次以上)
熟练(出现2~10次)
一般(出现1次)
|
字段名 |
数据类型 |
备注 |
|
id |
int |
id字段数据为整型数值 |
|
name |
text |
name |
|
sage |
Datetime |
字段数据为字符型 |
|
sscx |
text |
sage字段数据为日期时间型 |
-
(1) 若要建立上述的data_ r数据表和字段,则SQLite数据库命令为:
-
(2) 在data_r数据表中,使用sqlite3数据库命令添加如下记录。
id
name
sage
ssex
1
张婷
2007- 1- 15
男
其命令代码为:
-
(3) 使用Python语言编写了名为ins._data和find_data的函数,分别实现在test.db文件中datar数据表插入一条记录和查找满足条件的记录,部分代码如下。
import sqlite3
conn = sqlite3.connec("test.db") #打开数据库
""添加记录函数""
def ins_ data(cu):
sql1 = "insert into data_ r (id, name, ssex) values ('16', '张婷', '女')"
cu.execute(sql)
conn.commit( )
"查询函数find(字段名,字段值)"
def find_ data(cu, xb):
print(cu.fetchall( )) #输出满足条件的所有记录
"主程序”
cur = conn.cursor( ) #创建游标
ins_ data(cur) #在游标处插入记录
xb="女"
find_ data(cur, xb) #调用函数查找字段ssex为变量xb的值
cur.close( )#关闭游标
conn.close( )
请在方框划线划线处完善查询记录find_data( )函数的代码,实现在test.db文件中data_ r数据表查询所有ssex字段值为xb的所有记录数据,并输出满足条件的所有记录。
-
(4) 使用Python语言编写程序。实现将data_r数据表中的id为1记录数据转换为JSON格式的数据,并保存到tusjson文件中。
import json #导入json库
file = open('tus. json', 'w', encoding='utf-8') #建立tusjson文件
b=[ ]
cur = conn.cursor( )
#将游标cur设置为id=1的记录,代码略
① #将游标处的记录存储到列表变量b中
Json.dump( ② , file) #dump是json函数,实现将数据保存到文件中
file.close( )
为实现上述功能,请在①处编写Python代码实现“将cur处的所有记录数据添加到列表变量b中”;划线②处应填入合适的代码为。
from flask import Flask, render_ template #导入Flask库
app = Flask(_ name_ )
①
def index( ):
#获取数据库中传感器采集的数据,并存储在变量temp中,代码略
![]()
if ②
app.run(host= ③ )
-
(1) 为实现上述功能,请在划线处填入合适的代码。
① ② ③
-
(2) 简单描述方框处代码的功能:
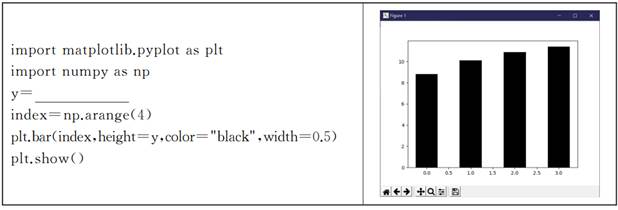
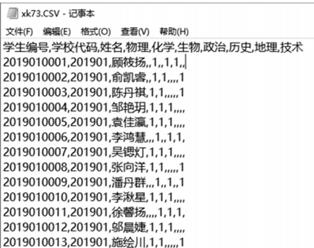
图1

图2
实现上述功能的Python程序如下:
import pandas as pd
import itertools
#读数据到pandas的 DataFrame结构中
df= ① (”xk73.csv”,sep=‘.’,header=‘infer’,encoding=‘utf-8’)
km=[‘物理’ ,‘化学’ ,‘生物’ ,‘政治’ ,‘历史’ ,‘地理’ ,‘技术’ ]
![]()
#按学校分组计数
sc=df.groupby(‘ ② ’,as_index=False).count( )
#对分组计数结果进行合计,合计结果转换为 DF结构并转置为行
df_sum=pd.DataFrame(data=sc.sum()).T
df_sum[‘学校代码’]=‘合计’
#增加"合计"行
result=sc.append(df_sum)
#百分比计算
df_percent=df_sum
df_percent[‘学校代码’]=‘比例’
for k in km:
per=df_percent.at[0,k]/zrs
df_percent[k]=per
#增加"百分比"行
result=result.append(df_percent)
#删除"姓名"列
result= ③
#修改"学生编号"为"总人数"
result=result.rename(columns={‘学生编号’:‘总人数’})
#保存结果,创建 Excel文件.生成的 Excel文件
result.to_excel("学校人数统计.xlsx")
-
(1) 请在划线处填入合适的代码
① ② ③
-
(2) 加框处语句的作用是
|
图 a |
-
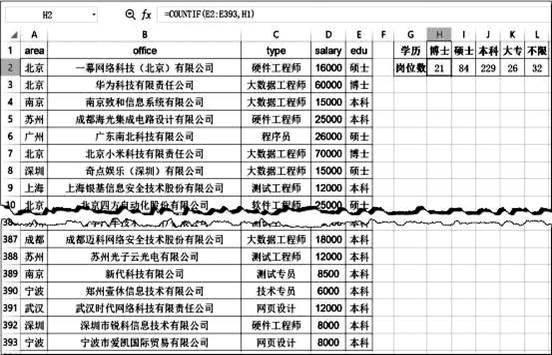
(1) 为统计各学历在招聘信息中的岗位数,选中H2单元格输入公式,然后利用自动填充完成I2:L2的数据计算,发现结果计算有误,请修改H2单元格中的计算公式 。(提示:COUNTIF函数用于对指定区域中符合指定条件的单元格计数。如:=COUNTIF(E2:E393,H1)表示计算E2:E393区域中学历为“博士”的人数)
-
(2) 将C列、D列数据复制并粘贴到新的Excel表格cs.xlsx中,根据其中的数据利用Python 程序计算出如图b所示结果,并建立如图c所示的图表,请在划线处填入合适的代码。
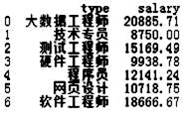
图 b
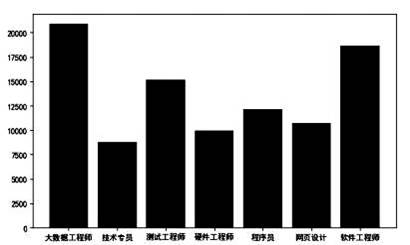
图 c
pandas as pd
import matplotlib.pyplot as plt
df=pd.read_excel("cs.xlsx")
g=df.groupby(‘type’,as_index=False)
datas=
print(round(datas,2))
name= datas[‘type’]
colleges=datas[‘salary’]
plt. (name, colleges)
plt.show( )
from PIL import Image
import numpy as np
import matplotlib.pyplot as plt
choicelist,choice=[50,128,188,255],256
for i in choicelist:
if i<choice:
choice=i
fn='tiger02.jpg'
img=np.array(Image.open(fn).convert('L'))
rows,cols=img.shape #图像尺寸分别赋值
for i in range(rows): #依次取每个像素的坐标
for j in range(cols):
if (img[i,j]<=choice): #像素值小于等于指定值,赋值1,否则为0
img[i,j]=0
else:
img[i,j]=1
plt.figure("tiger128") #指定当前绘图对象
plt.imshow(img,cmap='gray') #显示灰度图像
plt.axis('off') #关闭图像坐标
plt.show() #弹出包含了图片的窗口
 B .
B .  C .
C .  D .
D . 
|
1 bmp 1 bmp属性截图 |

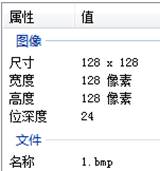
| #程序段 1: from PIL import Image import numpy as np import matplotlib.pyplot as plt img=np.array(Image.open('1.bmp').convert("L")) rows,cols=img.shape#获取图像的行数和列数 for i in range(rows): for j in range(cols): if img[i,j]>128: img[i,j]=0 #设置为黑色 else: img[i,j]=1 #设置为白色 plt.figure("1.bmp") plt.imshow(img,cmap="gray") #以灰度模式显示 plt.axis("off") plt.show() |
说明:以上程序段1实现将1.bmp 以黑底白字显示
请根据以上信息回答下列问题:
-
(1) 程序段1运行过程中,变量j的值范围是;
-
(2) 程序段2调试时出现“IndexError: index 128 is out of bounds for axis 1 with size 128”的提示,则上述程序出现这个错误的语句是;
A. rows,cols=img.shape B. for i in range(rows)
C. img[i,j],img[i,cols-j]=img[i,cols-j],img[i,j] D. plt.imshow(img,cmap="gray")
应该修改为:;
-
(3) 将第(2)题表述的错误修改正确后,程序段2运行后图片呈现的内容:。
#程序段 2:
from PIL import Image
import numpy as np
import matplotlib.pyplot as plt img=np.array(Image.open('1.bmp').convert("L"))
rows,cols=img.shape
for i in range(rows):
for j in range(cols//2):
img[i,j],img[i,cols-j]=img[i,cols-j],img[i,j]
plt.figure("hh")
plt.imshow(img,cmap="gray")
plt.axis("off")
plt.show()
-
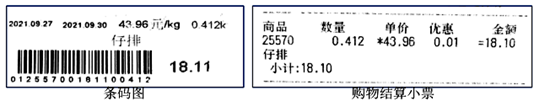
(1) 根据以上条码图和购物小票信息,如果客户购买了 1kg 仔排,条码秤打印出来的条码编码是。
-
(2) 购物结算清单中的下列信息来自数据服务器的是(多选题) ;A . 商品名称 B . 商品单价 C . 会员积分 D . 商品重量 E . 商品总金额
-
(3)
以上是解决这个问题而设计的一种算法,该算法中①处该填写, 该算法中②处填写;
A. ty!=‘01’ B. ty==‘01’ C. ty!=01 D. ty==01
-
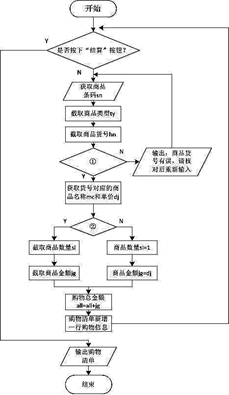
(4) 根据此算法,编写如下代码实现收银机功能(用输入字符串;‘end’模拟“结算”按钮,用键盘输入条形编码模拟扫描输入,把购物清单输出到文本文件list
 txt模拟打印购物清单):
sp={} #商品信息字典
#此处代码功能从数据服务器中获取商品信息字典 sp,sp 的结构为{'商品货号':'商品名称,商品单价'}
alljg=0.0 #保存结算总金额
sn=input('请输入商品条形码:')
#######################################################
#完成购物清单文本文件头处理 f=open('list.txt', 'r+') #打开文本文件
list.txt f.truncate() #清空文本文件内容
f.write('货号\t\t 商品名称\t 数量\t 单价\t 金额\n')
########################################################
while ▲
ty=sn[0:2] #获取商品类型
hn=sn[2:7] #获取商品货号
if hn in sp:
mc=sp[hn].split(', ')[0] #获取商品名称
dj=float(sp[hn].split(', ')[1]) #获取商品单价 if
ty!= '01':
sl=1.0
jg=dj
else:
sl=float(sn[12:14]+'. '+sn[14:17])
▲
print('{:<10s}{:<20s}{:^10.3f}*{:^10.2f}={:^10.2f}'.format(hn, mc, sl, dj, jg))
#按格式输出内容,主要目的保持输出的内容上下按类别对齐
f.write(hn + '\t\t' + mc + '\t' + str(sl) + '*\t' + str(dj) + '=\t' + str(jg) + '\n')
#往文本文件中写入购物记录信息
alljg+=jg
else:
print('商品货号有误,请核对后重新输入')
▲
print('小计:{:.2f}'.format(alljg))
f.write('---------------------------------------\n') #文本文件输出分割线
f.write('小计:'+str(alljg)) #往文本文件中写入总计信息
f.close#关闭 list.txt 文件
横线处代码应填、、
|
图1 |
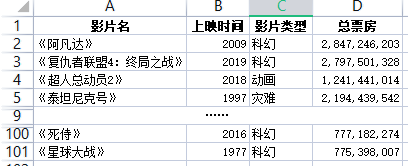
-
(1) “票房前100名.xlsx”属于(填字母:A .结构化\ B .非结构化 \ C .半结构化)数据。
-
(2) 如想要筛选得到该表内复仇者联盟各部剧的信息,以下可以操作的是 (多选题)A .
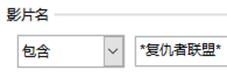 B .
B .  C .
C . 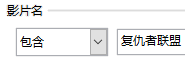 D .
D . 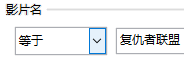
-
(3) 要用Python实现如图2所示图表,代码如下,请在程序①②③划线处填入合适的代码。
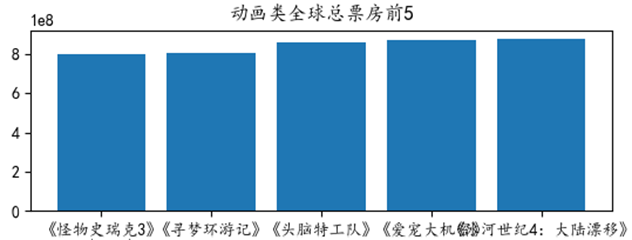
图2
import pandas as pd
import matplotlib.pyplot as plt
df=pd.read_excel("票房前100名.xlsx")
yplx=input("输入影片类型:")
df1= df[] #对df取某类型电影的数据
df2=df1.sort_values("总票房",ascengding=False). #按总票房降序并取前5名
x=df2["影片名"]
y=
plt.bar(x,y)
plt.title(yplx+"类全球总票房前5") #设置图标题
plt.show() #显示图
 图1
图1
-
(1) 为了绘制某监测站24小时PM2.5的浓度变化趋势,小明需要对图1所示的表中数据进行整理,下列选项中说法不正确的是( ) (单选)A . 通过检测发现E2单元格中的数据不正确,应进行修正 B . 应删除第10行数据 C . 第3行和第4行数据重复,应该删除其中一行数据 D . 删除“0时”和“24小时平均浓度”两列数据,图3绘制结果保持不变
-
(2) 区域AA2:AA39的数据是通过公式计算出相应的平均值的,在AA2单元格中输入公式,再使用自动填充功能完成区域AA3:AA39的计算。
-
(3) 接着,小明对图1中的数据进行整理后,转为csv文件,如图2所示。小明根据要求编写程序,绘制的‘临平镇’站点24小时变化趋势图如图3所示,程序运行结果如图4所示。实现的Python程序如下,请在划线处,填入适当的语句或语句表达式。
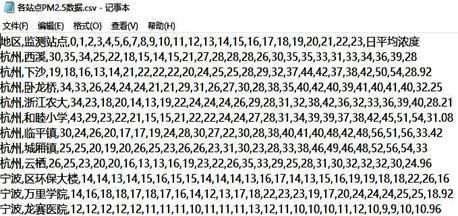 图2
图2 图3
图3 图4
图4import pandas as pd
import matplotlib.pyplot as plt df=pd.read_csv("各站点 PM2.5 数据.csv")
s1=df["日平均浓度"] #将 DataFrame 中“日平均浓度”列的数据读到s1中
#求浓度最低的站点
minx=s1[0] n=len(s1) t=0
for i in range(1,n):
if s1[i]<minx:
minx=s1[i]
t = i
print('浓度最低的站点是(填写监测站点名称):',,'浓度为:',minx) g=df.groupby('地区',as_index=False)
s=g.日平均浓度.mean()
s_sort=s.sort_values("日平均浓度",ascending=False) #各地区按照日平均浓度进行降序排序
print("求 PM2.5 平均浓度最高的三个区:\n",))
#绘制的‘临平镇’监测站点24小时变化趋势图
b=list(df.values[5][2:-1]) #将‘临平镇’每个时间段的数据存入列表b中
x=[];y=[]
for i in range(len(b)):
x.append(i)
y.append(b[i]) plt.plot()
plt.title("临平镇24小时PM2.5变化趋势图")
plt.rcParams['font.sans-serif']=['SimHei'] #使中文字在视图中正常输出plt.rcParams['axes.unicode_minus']=False
plt.show()
 图 a
图 a
-
(1) 在Excel软件中打开“2022BJ.xlsx”文件,为了计算各国的奖牌总数,小李先在F2单元格中利用求和函数得出挪威的奖牌总数,然后利用填充柄完成区域F3:F30的各国奖牌总数的计算,则在F4单元格中中国的奖牌总数的计算公式是。
-
(2) 为了提高效率,小李利用 Python 编程对 Excel 工作簿文件进行数据分析,设计如下 Python程序代码,请根据要求在划线处填入合适的代码或完成相应操作的选择。
import pandas as pd
import matplotlib.pyplot as plt
plt.rcParams['font.sans-serif'] = ['SimHei'] # 使图形中的中文正常编码显示
df=pd.read_excel("① ") # 读取Excel文件
print(② ) # 筛选出金牌数前10名(即顺序号小于等于 10)的记录并打印
dfs= ③ # 筛选出奖牌总数前 10 名的记录,并按从高到低排序输出给 dfs print(dfs) # 打印 dfs
#第一部分代码结束
③处代码有多种写法,以下代码中不能达成此操作的是 (单选,填字母) A.df.sort_values("奖牌总数",ascending=True).tail(10)
C. dfs=df.sort_values("奖牌总数",ascending=True)[:-11:-1]
C.df.sort_values("奖牌总数",ascending=False)[:10]
D.df.sort_values("奖牌总数",ascending=False).head(10)
以下为第二部分代码,用于绘制如图b所示图形。
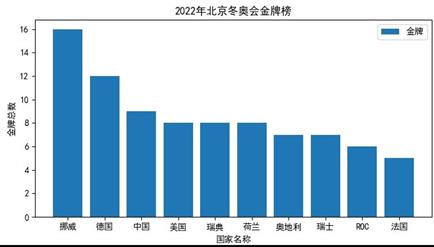 图 b
图 bplt.figure(figsize=(8,4))
plt.title("2022 年北京冬奥会金牌榜") # 显示图表标题
plt. ④(df[:10]
国家,df[:10].金牌, label="金牌")
plt.xlabel("国家")
plt.ylabel("金牌总数")
plt.legend( ) #显示图例
plt.show( )
#第二部分代码结束


